Zig-Zag Open Interest Footprint [Kioseff Trading]Hello!
This script "Zig Zag Open Interest Footprint" calculates open interest x price values for zig zag trends!
Features
Open interest footprints anchored to zig zag trends
Summed OI x price level footprints
Total OI (for each category) for the entire trend shown
Standard POC lines, in addition to separated POC lines for each category of open interest x price possibility
Up to 9999 profile rows per zigzag trend
Stylistic options for profiles
Configurable zig zag - footprints generated for small to large trends
The zigzag indicator is configurable as normal; minor and major trend volume footprints are calculable. This indicator can be thought of as "Open Interest Footprint for Trends''.
Up to 9999 open interest levels (price levels) can be calculated for each profile, thanks to the new polyline feature, allowing for less aggregation / more precision of open interest at price.
Zig Zag OI Footprints
The image above shows primary functionality!
Green = Higher OI + Higher Price
Yellow = Lower OI + Higher Price
Purple = Higher OI + Lower Price
Red = Lower OI + Lower Price
Profiles are generated for each trend identified by the zigzag indicator.
The image above shows the indicator calculating open interest x price for specific price blocks on the footprint. Aggregate open interest for the identified trend is displayed over the profile!
Neon highlighted values correspond to the highest open interest change for the category. This is a configurable option :D
The image above shows POC lines for each category of open interest x price!
Additionally, you can select to show a single POV for footprint - the single level the greatest amount of OI change occurred.
The indicator is robust enough to calculate on "long zig zags" and "short zig zags"; curved profiles can also be used!
The image above shows key levels, each OI footprint, and summed OI values for the current trend!
That's about it :D
This indicator is part of a series titled "Bull vs. Bear" - a suite of profile-like indicators I will be releasing over the coming days. Thanks for checking this out!
If you have any suggestions please feel free to share!
ابحث في النصوص البرمجية عن "key levels"

Zig-Zag Volume Profile (Bull vs. Bear) [Kioseff Trading]Hello!
Thank you @Pinecoders and @TradingView for putting polylines in production and making this viable!!
This script "Zig Zag Volume Profile" implements the polyline feature for Pine Script!
Features
Volume Profile anchored to zig zag trends
Bull vs Bear profiles!
Delta x price level
Standard POC and value area lines, in addition to separated POCs and value area lines for bull profiles and bear profiles
Up to 9999 profile rows per zigzag trend
Stylistic options for profiles
Configurable zig zag - profiles generated for small to large trends
Polylines!
This script generates Bull vs. Bear volume profiles for zig zag trends!
The zigzag indicator is configurable as normal; minor and major trend volume profiles are calculable. This indicator can be thought of as "Volume Profile/Delta for Trends''.
Up to 9999 volume profile levels (price levels) can be calculated for each profile, thanks to the new polyline feature, allowing for less aggregation / more precision of volume at price and volume delta.
Zig Zag Bull Vs Bear Profiles
The image above shows primary functionality!
Green profiles = buying volume
Red profiles = selling volume
Profiles are generated for each trend identified by the zigzag indicator.
The image above shows the indicator calculating volume delta for specific price blocks on the profile. Aggregate volume delta for the identified trend is displayed over the profile!
The image above shows Bull Profile POC lines and value area lines. Bear Profile POC lines and value area lines are also shown!
All colors and transparencies are configurable to the user's liking :D
Additionally, you can select to have the profiles drawn on contrasting sides. Bull Profile on left and Bear Profile on right.
For a more traditional look - you can select to draw the Bull & Bear profiles on the same x-point.
The indicator is robust enough to calculate on "long zig zags" and "short zig zags"; curved profiles can also be used!
The image above exemplifies usage of the indicator!
Bull & Bear volume profiles are calculated for trends on the 30-second timeframe.
The image above shows a more "utilitarian" presentation of the profiles. Once more, line and linefill colors/transparencies are all customizable; the indicator can look however you would like it to!
The image above shows key levels, the Bull vs. Bear profile, and volume delta for the current trend!
That's about it :D
This indicator is part of a series titled "Bull vs. Bear" - a suite of profile-like indicators I will be releasing over coming days. Thanks for checking this out!
Of course, a big thank you to @RicardoSantos for his MathOperator library that I use in every script.
If you have any suggestions please feel free to share!

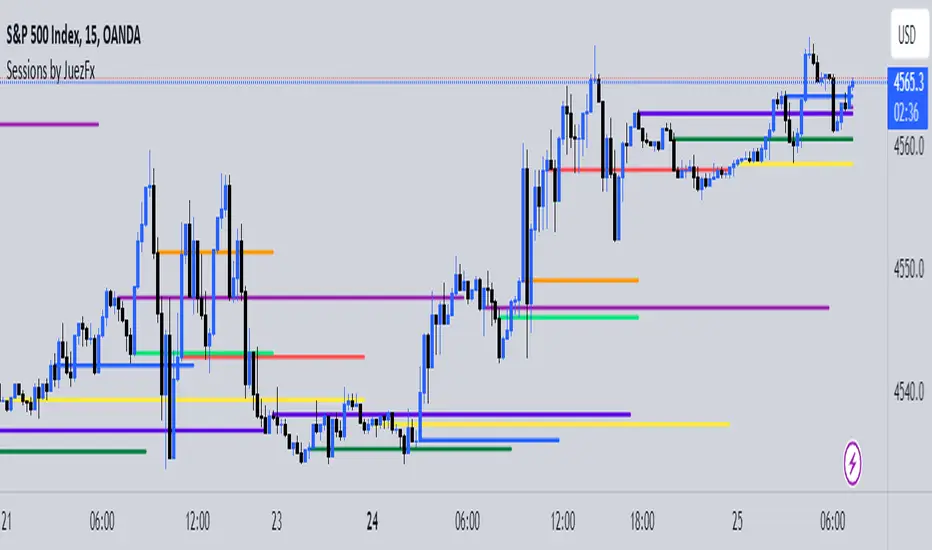
Sessions by JuezFxLines Plotted at the opening price of London, New York, New York Stock Exchange, and Asia. It could also plot lines of the closing price of the session.
The script is just plotting a line at those levels to give us a visual indicator of those specific levels as they could be very beneficial for your trading. Opening and closing of the session hold the most liquidity, attracting the market towards it.
I hope this script will help you in your trading and you can use those levels along with other confluences in order to identify key levels that the market could react from!
There are some similar scripts but this one have more lines to plot at could be identified by different color and line thickness!
Yearly Open LevelsThis script is a custom indicator for TradingView that shows the yearly open price levels on a chart. It differs from other scripts as it plots a single line for each year, showing the open price for that year, and labels the line with the year and open price. This indicator can be useful for identifying key levels of support and resistance based on the yearly open price.
To use this indicator, you need to add it to your TradingView chart and adjust the input parameters, such as the starting year and color. The script will then automatically plot lines and labels for each year's open price.
This script can be used in any market that has a yearly open price, such as stocks, futures, forex, and cryptocurrencies. However, it may be most useful in markets that tend to have significant year-to-year price movements, as it can help identify important levels of support and resistance. It may also be most effective in markets with a clear yearly cycle, such as those that tend to be influenced by seasonal factors.

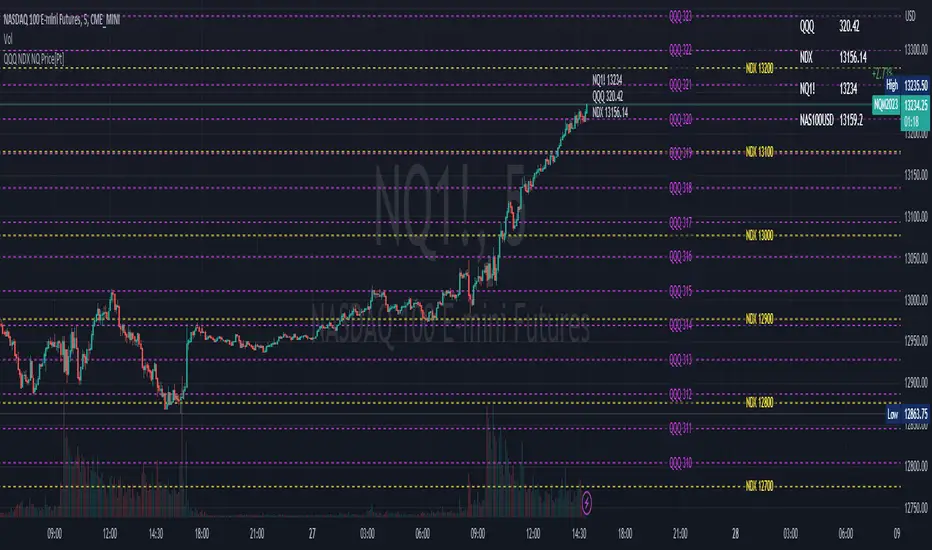
QQQ NDX NQ Price Converter [Pt]A must have tool for QQQ NDX NQ traders~!!!
Description
The QQQ NDX NQ Price Converter is a powerful and easy-to-use tool that allows traders to view corresponding price levels for linked instruments in real-time. This includes QQQ, NDX, NQ, and NAS100USD. Although these instruments often move in sync, differences in price movements, volume, and trading hours can create unique key levels and support/resistance areas for each. By mapping these levels on the same chart, traders can more easily spot trading opportunities and improve their chances of success.
Customizable features
- multiplier from the closest whole number price level
- line color
- line style
- label position / size
- # of levels to display
- toggle current price display table
CPR with inside candle, Pivot Points and 4EMA The CPR trading strategy is a technical analysis approach that combines multiple indicators to determine potential price levels and trading opportunities. The strategy uses three main components: Inside Candles, Pivot Points, and the 4EMA.
Inside Candles: The Inside Candle pattern is a candlestick pattern where the current candle has a lower high and a higher low than the previous candle. This pattern can indicate a period of consolidation or indecision in the market and can signal a potential reversal or continuation of the trend.
Pivot Points: Pivot Points are technical indicators that use the previous day's price data to calculate key levels of support and resistance for the current trading day. These levels can act as potential areas of buying or selling pressure and can help traders identify potential entry and exit points.
4EMA: The 4EMA is a short-term Exponential Moving Average that tracks the average price of an asset over the previous four periods. This indicator is used to help identify short-term trends in the market and can signal potential buying or selling opportunities.
To apply the CPR strategy, traders first look for Inside Candles on their chart, indicating a period of consolidation or indecision in the market. Next, they identify the Pivot Points for the current trading day, which can act as potential areas of support or resistance. Finally, traders use the 4EMA to confirm the direction of the trend and potential entry or exit points.
For example, if an Inside Candle forms at a Pivot Point level and the 4EMA is indicating an uptrend, this could be a potential buying opportunity. Conversely, if an Inside Candle forms at a Pivot Point level and the 4EMA is indicating a downtrend, this could be a potential selling opportunity.

Convert ETF to Futures/IndexThis indicator is used to automatically map an ETF's VWAP and 10 levels above and below the strike of your choice, to the futures or index instrument currently being viewed/traded. This works very well when using both SPY to ES/MES/SPX or QQQ to NQ/MNQ/NDX to plot the ETF strikes and can lead to some incredible trades, especially when trading level to level. Since SPY, QQQ, IWM, and DIA have the same price action as their futures iteration, there seems to be a direct correlation between their levels and VWAP . This indicator is made to easily map these key levels to the appropriate futures instrument. If you have a way to measure GEX centered around a certain level, I recommend color coding the lines to help indicate whether the level will have strong positive or negative gamma hedging associated with it.

SPY to ES or QQQ to NQThis indicator is used to automatically map SPY VWAP and 10 levels of your choice to ES / MES or map QQQ VWAP and 10 levels of your choice to NQ / MNQ . Since SPY and QQQ have the same price action as their futures iteration, there seems to a direct correlation between their levels and VWAP. This indicator is made to easily map the key levels of your choice to the appropriate futures instrument.

SupportResitanceAndTrendLibrary "SupportResitanceAndTrend"
Contains utilities for finding key levels of support, resistance and direction of trend.
superTrendPlus(multiple, h, l, atr, closeBars)
A more flexible version of SuperTrend that allows for supplying the series used and sensitivity adjustment by confirming close bars.
Parameters:
multiple : The multiple to apply to the average true range.
h : The high values.
l : The low values.
atr : The average true range values.
closeBars : The number of bars to confirm a change in trend.
Returns:
superTrend(multiple, period, mode, closeBars)
superTrendPlus with simplified parameters.
Parameters:
multiple : The multiple to apply to the average true range.
period : The number of bars to measure.
mode : The type of moving average to use with the true range.
closeBars : The number of bars to confirm a change in trend.
Returns:
superTrendCleaned(multiple, period, mode, closeBars, maxDeviation)
superTrendPlus with default compensation for extreme volatility.
Parameters:
multiple : The multiple to apply to the average true range.
period : The number of bars to measure.
mode : The type of moving average to use with the true range.
closeBars : The number of bars to confirm a change in trend.
maxDeviation : The optional standard deviation level to use when cleaning the series. The default is the value of the provided level.
Returns:
stochSR()
Identifies support and resistance levels by when a stochastic RSI reverses.
Returns:
stochAVWAP()
Identifies anchored VWAP levels by when a stochastic RSI reverses.
Returns:

Zig Zag ArmonyThis script try to help to identify flips and armonies using open and close values nstead hight and lows values.
For newbies, this script help to mark key levels for tendency continuation & breaking off
For flips and armony levels identification
3 levels recommended
30 Bars / Purple / line 5
15 Bars / Red / line 4
5 Bars / Black / line 3
Based on "Zig Zag High Low por Tr0sT"

Risk Management: Position Size & Risk RewardHere is a Risk Management Indicator that calculates stop loss and position sizing based on the volatility of the stock. Most traders use a basic 1 or 2% Risk Rule, where they will not risk more than 1 or 2% of their capital on any one trade. I went further and applied four levels of risk: 0.25%, 0.50%, 1% and 2%. How you apply these different levels of risk is what makes this indicator extremely useful. Here are some common ways to apply this script:
• If the stock is extremely volatile and has a better than 50% chance of hitting the stop loss, then risk only 0.25% of your capital on that trade.
• If a stock has low volatility and has less than 20% change of hitting the stop loss, then risk 2% of your capital on that trade.
• Risking anywhere between 0.25% and 2% is purely based on your intuition and assessment of the market.
• If you are on a losing streak and you want to cut back on your position sizing, then lowering the Risk % can help you weather the storm.
• If you are on a winning streak and your entries are experiencing a higher level of success, then gradually increase the Risk % to reap bigger profits.
• If you want to trade outside the noise of the market or take on more noise/risk, you can adjust the ATR Factor.
• … and whatever else you can imagine using it to benefit your trading.
The position size is calculated using the Capital and Risk % fields, which is the percentage of your total trading capital (a.k.a net liquidity or Capital at Risk). If you instead want to calculate the position size based on a specific amount of money, then enter the amount in the Custom Risk Amt input box. Any amount greater than 0 in the Custom Risk Amt field will override the values in the Capital and Risk % fields.
The stop loss is calculated by using the ATR. The default setting is the 14 RMA, but you can change the length and smoothing of the true range moving average to your liking. Selecting a different length and smoothing affects the stop loss and position size, so choose these values very carefully.
The ATR Factor is a multiplier of the ATR. The ATR Factor can be used to adjust the stop loss and move it outside of the market noise. For the more volatile stock, increase the factor to lower the stop loss and reduce the chance of getting stopped out. For stocks with less volatility , you can lower the factor to raise the stop loss and increase position size. Adjusting the ATR Factor can also be useful when you want the stop loss to be at or below key levels of support.
The Market Session is the hours the market is open. The Market Session only affects the Opening Range Breakout (ORB) option, so it’s important to change these values if you’re trading the ORB and you’re outside of Eastern Standard Time or you’re trading in a foreign exchange.
The ORB is a bonus to the script. When enabled, the indicator will only appear in the first green candle of the day (09:30:00 or 09:30 AM EST or the start time specified in Market Session). When using the ORB, the stop loss is based on the spread of the first candle at the Open. The spread is the difference between the High and Low of the green candle. On 1-day or higher timeframes, the indicator will be the spread of the last (or current) candle.
The output of the indicator is a label overlaying the chart:
1. ATR (14 RMA x2) – This indicated that the stop loss is determined by the ATR. The x2 is the ATR Factor. If ORB is selected, then the first line will show SPREAD, instead of ATR.
2. Capital – This is your total capital or capital at risk.
3. Risk X% of Capital – The amount you’re risking on a % of the Capital. If a Custom Risk Amt is entered, then Risk Amount will be shown in place of Capital and Risk % of Capital.
4. Entry – The current price.
5. Stop Loss – The stop loss price.
6. -1R – The stop loss price and the amount that will be lost of the stop loss is hit.
7. – These are the target prices, or levels where you will want to take profit.
This script is primarily meant for people who are new to active trading and who are looking for a sound risk management strategy based on market volatility . This script can also be used by the more experienced trader who is using a similar system, but also wants to see it applied as an indicator on TradingView. I’m looking forward to maintaining this script and making it better in future revisions. If you want to include or change anything you believe will be a good change or feature, then please contact me in TradingView.

Pivot Points 17 - StandardDisclaimer!
-This indicator doesn't tell you the market condition (BUY or SELL)
Cons!
- Totally dependent on your knowledge
Pros!
- Projects the Key Levels of a single time frame on the chart
Usage!
- Watch out for rejections at these levels
- Identify breakouts at these levels with strong confirmation like RETEST (as Level Role Reversal)

Reverse RSI Channel — SharkCIAGet a clear picture of trend direction by visualizing RSI levels on your charts.
Green = buy zone, red = sell zone.
The RERSI was first developed by Giorgos Siligardos in the June 2003 issue of Stocks and Commodities Magazine. RERSI plots lines on the price chart that reflect levels of the RSI.
Modified from
Original implementation by HPotter

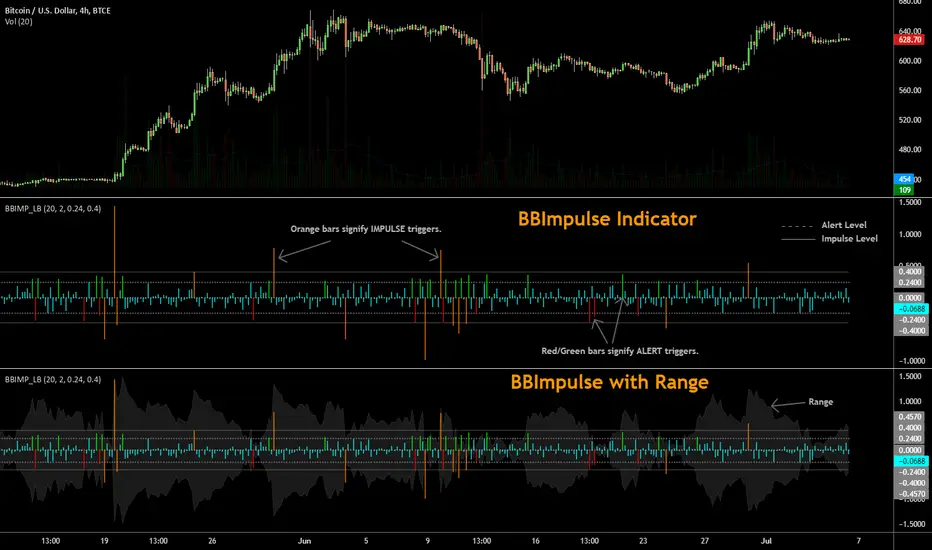
BBImpulse IndicatorBBImpulse is part of the latest indicators package offered by John Bollinger. Excerpt from their market blurb (www.bbforex.com):
"BBImpulse is derived from %b. Its value is the periodic change of %b, so if %b was 0.45 this period and 0.20 last period the present value of BBImpulse is 0.25. We present two reference levels on the chart, an alert level and an impulse level."
"Generally the market moves in the direction of the latest alerts and/or impulses except towards the end of a move where one can take advantage of exhaustion/reversal signals from this indicator."
"Ian Woodward employs BBImpulse for his Kahuna signals using key levels of 0.24 and 0.40."
I added support for the following:
- Highlighting alert/impulse trigger bars
- Rendering the range (check options page).
I noticed that the range, by itself, highlights lot of info:
- Tapering in (narrowing) of range may signify topping or falling prices.
- Tapering out (expanding) may signify nearing a bottom or rising prices.
- Range getting "ranged" between alert or impulse levels signify a major move in the direction of the last impulse trigger. I think for this, alert level ranging intensity is greater than impulse level ranging intensity.
Someone more familiar with BB will have more observations, I am sure. Please do share here so we BB noobs can learn :)
For more indicators, check out my complete list here:
Volume Buy/Sell Pressure with Hot PercentFULL DESCRIPTION (Condensed Version)
Volume Buy/Sell Pressure with Hot Percent
Professional volume analysis indicator revealing real-time buying and selling pressure with hot volume detection and customizable alerts.
Key Features:
Three-Layer Histogram - Visual breakdown: total volume (gray), buying pressure (bright green), selling pressure (bright red)
Flexible Display - Toggle between percentage view or actual volume counts for buying/selling pressure
Real-Time Metrics - Live buying/selling data, current bar volume, daily totals, 30-bar/30-day averages with comma formatting
Hot Volume Detection - Automatic alerts with white triangle markers when volume exceeds threshold
Customizable Labels - 4 sizes (Small/Normal/Large/Huge), 9 positions (all corners/centers/middles), toggle any metric on/off
Smart Color Coding - Green (high volume/buying dominant), Red (selling dominant), Orange (equal pressure), Gray (low volume). Black text on bright backgrounds for maximum contrast.
Alert Conditions:
Hot Volume: Triggers when volume exceeds moving average by specified percentage
Unusual 30-Bar Volume: Current bar significantly above 30-bar average
Unusual 30-Day Volume: Daily volume significantly above 30-day average
Settings:
Display - Toggle metrics, choose percentage/count display, select size and position
Volume - Set unusual volume threshold (default 200%), adjust average length (default 21)
Hot Volume - Choose SMA/EMA, set lookback period (default 20), define threshold (default 100%)
Perfect For:
Day traders scalping futures (MNQ, MES, MYM, MGC, MCL)
Swing traders identifying accumulation/distribution
Breakout traders needing volume confirmation
All timeframes - tick charts to daily/weekly
Use Cases:
Confirm trend strength with pressure alignment
Spot reversals when pressure diverges from price
Validate breakouts with hot volume alerts
Identify smart money through unusual volume
Track institutional activity at key levels
What Makes This Different:
Shows buying vs selling pressure WITHIN each bar using price range methodology. Most indicators only show total volume or simple up/down. This reveals actual pressure distribution regardless of bar direction. Three-layer design makes order flow instantly visible.
Pro Tips:
Use "Large" labels at 100% zoom
Enable volume count display for position sizing
Position labels in corners to avoid price overlap
Enable alerts during pre-market and news events
Watch for divergences: price up + selling pressure up = potential reversal
Compare to both 30-bar and 30-day for full context
Technical:
Pine Script v6
All timeframes and instruments
No repainting
Efficient code, minimal CPU
Three alert conditions
Works on futures, stocks, forex, crypto
Clean, professional presentation. Essential for volume analysis and order flow tracking.

BULLISH!! Low High Range Options HelperThis indicator is designed for range-based options trading, where price tends to rotate between a defined low and high rather than trend continuously. Its purpose is not to tell you what to trade, but to provide context for timing, specifically answering the question: if price is at a discount here, how much time should an option realistically have?
The script identifies a recent price range and plots three key levels. The range high represents the upper boundary of recent price action and often acts as a take-profit or resistance area. The range mid is the 50 percent equilibrium of the range and is intended as a confirmation level rather than an entry signal. The range low represents the discount zone, where risk is best defined for bullish options trades. This is the only area where options guidance is displayed.
When price touches the range low, the indicator calculates how long similar range rotations have taken in the past, adjusts that timing to the current chart timeframe, and applies a safety factor to reduce the risk of under-timing an options position. It then displays a suggested days-to-expiration label, such as 3 DTE, 4 DTE, 5 DTE, 6 DTE, 7 DTE, 10 DTE, or 14 plus. Shorter DTE values reflect faster expected rotations, while longer DTE values reflect slower, choppier, or more uncertain conditions. The goal is to help avoid the common mistake of buying options that do not have enough time to work.
A typical way to use this tool is to identify a clearly defined range, wait for price to reach the range low, note the DTE guidance shown on the chart, then wait for confirmation such as a reclaim of the range midpoint before considering a trade. Risk can then be managed with the range structure in mind, often targeting the range high in rotational environments. The indicator is most effective in sideways or mean-reverting markets rather than strong trends.
This script does not place trades, predict direction, or guarantee outcomes. It does not account for news events, earnings, implied volatility changes, or broader macro conditions. It is intended as a contextual tool to support disciplined decision-making, not as a standalone trading system.
Always trade smart. Manage position size, define risk before entering a trade, and avoid over-leveraging short-dated options. The objective is not to predict the market, but to consistently align price structure with realistic time expectations.

VSA Effort Result v1.0VSA Effort vs Result by StupidRich
Detects volume-spread divergence:
- "Er": High volume, narrow spread (absorption)
- "eR": Low volume, wide spread (momentum)
Features:
• Clean text labels (customizable size)
• Wide vertical lines matching candle range
• Adjustable thresholds & volume SMA
• Works on all timeframes/assets
Perfect for spotting institutional absorption at key levels.
if u wanna buy me a coffee, just dm @stupidrichboy on Telegram
hope it help

Premarket High/Low (Today + Yesterday)Plots Premarket High and Low (04:00–09:30 ET) for the current day and previous day.
Designed for intraday traders who use premarket structure as key levels.

fmfm12 chosen chart timeframe. It monitors the price to determine:
Whether resistance has been broken → BUY signal
Or support has been broken → SELL signal
After a breakout or breakdown, the indicator automatically draws price targets (T1 / T2 / T3) as percentages from the breakout point, and also displays FVG (Fair Value Gaps) zones that indicate imbalances between supply and demand.
⚙️ Main Components
Support and Resistance Levels (Key Levels)
Automatically calculated from the 4-hour timeframe (180 minutes).
Draws lines:
Green = Resistance
Red = Support
Option to display a midline (blue).
Line style (solid / dashed / dotted), thickness, and label size are customizable.
Trading Signals (Signals)
When resistance is broken upward → BUY signal (green).
When support is broken downward → SELL signal (red).
Signal size is adjustable (small / large, etc.).
Price Targets (Targets)
After confirming a breakout or breakdown, the indicator draws:
T1 / T2 / T3 as horizontal lines in the breakout direction.
Target percentages are adjustable (default: 0.5%, 1%, 1.5%).
Different colors for bullish and bearish targets.
Fair Value Gaps (FVG)
Detects bullish and bearish gaps within a set number of candles (default: 10).
Draws transparent colored zones:
Light Green = Bullish Gap
Light Red = Bearish Gap
📊 Practical Usage
Add the indicator to TradingView (paste the code into the Pine Editor, save, and add it to the chart).
When the price approaches a support or resistance line, observe:

JRockets MACDThis is my favorite indicator, that I use as one of my conformations before entering a trade in the 15M timeframe This MACD is tailor made by me to work efficient, consistent, and effectively. I back tested tons of times, it helps if you're entering too early, late and even get faked out. The MACD is by far my favorite and one and only indicator, and here's why. The MACD contains 2 EMA lines where it gives me a signal on when to buy or sell. If the Blue line crosses the red line on the bottom of the indicator its giving buy signals as long as the blue line stays on top, and when the red line crosses the blue line on top of the indicator its giving sell signals as long as the redline stay on top. Be sure to pay attention to the candle stick patterns as well and has to be around key levels. What makes this a better signal as well, the MACD has a built-in momentum hologram, some see it as overbought/undersold, or volume indicator. By combining the momentum hologram with your buy/sell ema will prevent you from entering a trade in the wrong area. The momentum hologram is almost self-explanatory, when there is buying pressure, the hologram turns blue, the darker the blue the stronger the momentum as well as the length of the hologram, once is start losing momentum it starts to turn to a lighter blue. Eventually a light red to a solid red showing momentum for a strong sell, this works vice versa. Combing all that at once and built instincts it becomes very effective. You can also use the EMA signals as divergence, but I don't really trade with divergence but could possibly give you conformation. Using the MACD is like having 3-4 indicators in one with all of them working fluent together. I have the MACD locked on the 15M timeframe because that's where it works more accurately. You can make the EMA lines a bit thicker to be easier to see. I would change the MACD visible for the 15M timeframe only or 1M to 1H timeframe. I hope this indicator helps you, as it did for me. You can simply click add on your charts on the top left to get this free indicator. Peace out and enjoy! Be sure to share, this indicator with your friends as it may help someone out.

Order Blocks+swl - Dual MTF Fixed ExtendedOrder Blocks+SWL - Dual MTF with Swing Validation
Overview
This advanced TradingView indicator combines Multi-Timeframe Order Block detection with Swing High/Low validation to identify high-probability supply and demand zones. The tool displays order blocks from higher timeframes and current timeframe, then highlights those that align with swing points for enhanced reliability.
🔧 Key Features
Multi-Timeframe Order Block Detection
- Current Timeframe: Detects order blocks on the chart's native timeframe
- HTF1 & HTF2: Two customizable higher timeframes (default: 60m, 240m)
- Independent Toggles: Enable/disable each timeframe's OBs separately
Smart Order Block Logic
- Long Order Blocks: Formed when current candle's LOW > middle candle's HIGH
- Short Order Blocks: Formed when current candle's HIGH < middle candle's LOW
- Persistent Display: Boxes extend until price fills the zone
- Color Coding:
- Current TF: Green (long) / Red (short)
- HTF1: Orange (long) / Maroon (short)
- HTF2: Blue (long) / Purple (short)
Swing Point Integration
-Swing Lows (SWL) & Swing Highs (SWH): Automatically detected using pivots
-Validation Overlay: Highlights order blocks that coincide with swing points
- Lime boxes: Long OBs with SWL confirmation
- Fuchsia boxes: Short OBs with SWH confirmation
Visual Elements
- Order Block Boxes: Semi-transparent zones with bold borders
- Entry Markers: Triangle shapes below/above bars for visual confirmation
- Swing Labels: SWL/SWH labels at pivot points
- Valid OB Overlay: Distinctive colored boxes for validated zones
⚙️ Input Parameters
Display Controls
- `Show Long OBs`: Toggle long order block display
- `Show Short OBs`: Toggle short order block display
- `Show Current TF OBs`: Display order blocks from current timeframe
- `Use HTF1/HTF2 OBs`: Enable higher timeframe order blocks
- `HTF1/HTF2`: Customizable timeframe strings
Technical Settings
- `My Input`: Maximum unfilled boxes to display (50-50000, default: 1000)
- `Swing Lookback / Forward Length`: Pivot detection sensitivity (default: 10)
📊 How It Works
1. Order Block Detection: The indicator scans three timeframes for specific candlestick patterns that indicate potential supply/demand zones.
2. Swing Point Detection: Simultaneously identifies swing highs and lows using pivot logic.
3. Validation Overlay: When an order block forms on the same candle as a swing point, it creates a special highlighted zone indicating higher probability.
4. Memory Management: Automatically manages box count to prevent performance issues while maintaining historical context.
🎯 Trading Applications
- Trend Continuation: Validated order blocks in trend direction offer high-probability entries
- Reversal Zones: Swing-aligned order blocks at key levels suggest potential reversals
- Multi-Timeframe Analysis: Higher timeframe OBs provide stronger support/resistance
- Zone Trading: Trade bounces from or breaks through validated zones
💡 Usage Tips
1. Prioritize Validated Zones: Focus on lime/fuchsia boxes as they have swing confirmation
2. Timeframe Hierarchy: HTF2 (240m) > HTF1 (60m) > Current TF for zone strength
3. Combine with Price Action: Use zones alongside candlestick patterns and volume
4. Risk Management: Place stops beyond opposite side of order block
⚠️ Limitations
- Not a standalone trading system - combine with other analysis
- May repaint on current bar until close
- Higher timeframes require sufficient historical data
- Swing detection sensitivity depends on length parameter
---
Note: This tool is for educational purposes. Always practice proper risk management and backtest strategies before live trading.

IPO MA Start DetectorWhat is this tool?
This indicator is designed specifically for Fresh IPOs and recently listed stocks. Standard indicators like the 50-day or 200-day Moving Averages do not appear on a chart until the stock has traded for enough days. This tool solves that problem by telling you exactly when these key levels will appear.
It visualizes the "birth" of a Moving Average, both in the past and in the future.
Key Features:
Future Forecasting: Projects vertical lines into the future to show exactly when a specific MA (e.g., 50 DMA) will start calculating.
Countdown Timer: Displays a countdown (e.g., "Starts in 12 days") so you don't have to count candles manually.
Historical Start Points: Marks the exact candle where an MA (like the 10 or 20 EMA) first appeared historically.
Clean & Subtle: Uses floating text without heavy background boxes to keep your chart clutter-free.
Dark Mode Optimized: Uses bright, neon colors (Lime, Cyan, Orange) that pop against dark backgrounds.
How it works:
The script calculates the age of the stock (bar count).
If the stock is younger than the required MA length (e.g., only 30 days old), it projects a dashed line to the 50th day.
It anchors a label to that future date, showing you the countdown.
Settings:
Toggle MAs: Turn on/off 10 EMA, 20 EMA, 50 SMA, 100 SMA, or 200 SMA individually.
Label Location: Customize where the future labels appear (Above Price, Below Price, or At Price) to avoid overlapping with candles.
Use Case: Perfect for traders tracking new listings who are waiting for the "20 EMA pullback" or "50 DMA anchor" strategies to become valid.

LockPoint TrackerLockPoint Tracker is a simple yet powerful tool for visually tracking price movement from a locked reference point.
Key Features:
• Lock any bar’s closing price with a single click.
• Reference line drawn at the locked price for clear visual context.
• “L” label marks the locked bar.
• Live percentage change label shows how far the current price has moved from the locked level.
• Green above the bar for gains, red below for losses.
• Automatically disappears on the next bar — always shows only the live value.
• Configurable label padding for optimal visibility on any chart or timeframe.
LockPoint Tracker is perfect for traders who want to monitor key levels, measure intrabar moves, or visually track performance from specific price points without cluttering the chart.
